# 数据库巡检报告
**Repository Path**: guoliangjun17/database-patrol-report
## Basic Information
- **Project Name**: 数据库巡检报告
- **Description**: 以后的数据库巡检报告
- **Primary Language**: Unknown
- **License**: Not specified
- **Default Branch**: master
- **Homepage**: None
- **GVP Project**: No
## Statistics
- **Stars**: 6
- **Forks**: 5
- **Created**: 2022-07-04
- **Last Updated**: 2025-01-15
## Categories & Tags
**Categories**: Uncategorized
**Tags**: None
## README
# **Centos7-shell生成MySQL数据库巡检报告**
## 前提
迫于网上有人卖收费的数据库巡检报告脚本(99块钱),但公司没钱买,既然他能写~为啥我就无法写呢?对不对,于是乎嘛我摊牌了我开源了..后续有兴趣我也能研究gp/pg的也不是什么事情...
## 执行效果
我觉得效果已经满足了吧
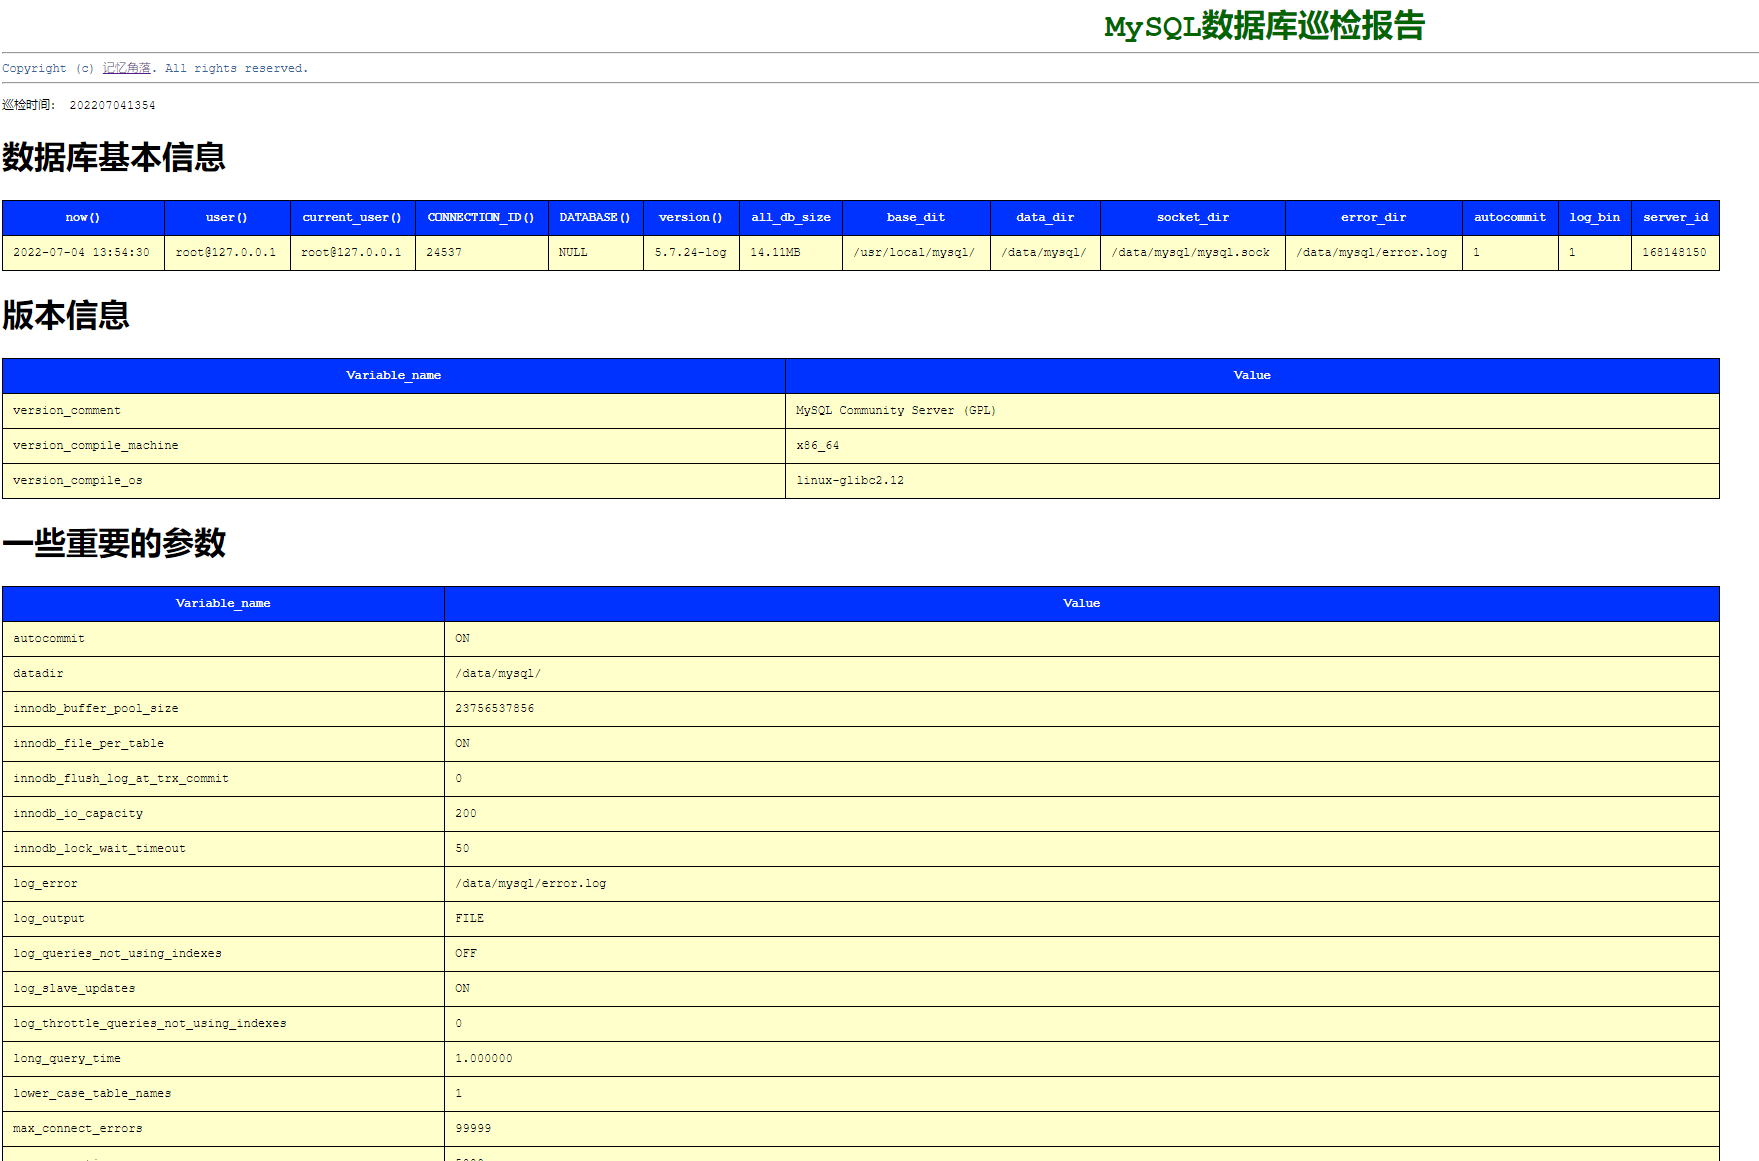
具体效果请查看:https://qn.199604.com/typoraImg/10.80.210.122_20220704.html
## 涉及的sql
```sql
--> 数据库基本信息
select now(),user(),current_user(),CONNECTION_ID(),DATABASE(),version(),all_db_size,@@basedir base_dit,@@datadir as data_dir,@@SOCKET as socket_dir,@@log_error as error_dir,@@AUTOCOMMIT as autocommit,@@log_bin as log_bin,@@server_id as server_id from (SELECT concat(round(sum(DATA_LENGTH/1024/1024),2),'MB') as 'all_db_size' from information_schema.TABLES) tmp
-->版本信息
show variables like '%version_comment%';
show variables like '%version_compile_machine%';
show variables like '%version_compile_os%';
-->当前数据库实例的所有数据库及其容量大小
select SCHEMA_NAME,DEFAULT_CHARACTER_SET_NAME,DEFAULT_COLLATION_NAME,
sum(table_rows) as '记录数',
sum(truncate(data_length/1024/1024, 2)) as '数据容量(MB)',
sum(truncate(index_length/1024/1024, 2)) as '索引容量(MB)',
sum(truncate((data_length+index_length)/1024/1024, 2)) as '总大小(MB)',
sum(truncate(max_data_length/1024/1024, 2)) as '最大值(MB)'
from information_schema.SCHEMATA ma
left join information_schema.tables ta on ma.SCHEMA_NAME = ta.table_schema
group by SCHEMA_NAME
order by sum(data_length) desc, sum(index_length) desc;
-->数据库对象
select * from (
SELECT table_schema as '数据库','TABLE' as '对象类型', COUNT(*) as '对象数量' FROM information_schema.TABLES GROUP BY table_schema
union
SELECT table_schema as '数据库','VIEW' as '对象类型', COUNT(*) as '对象数量' FROM information_schema.VIEWS GROUP BY table_schema
union
SELECT db as '数据库','PROCEDURE' as '对象类型',COUNT(*) as '对象数量' FROM mysql.proc WHERE `type` = 'PROCEDURE' GROUP BY db
union
SELECT db as '数据库','FUNCTION' as '对象类型',COUNT(*) as '对象数量' FROM mysql.proc WHERE `type` = 'FUNCTION' GROUP BY db
) tmp order by 数据库,对象类型
-->查看数据库的运行状态
root@localhost 00:10 [(none)]> status
--------------
mysql Ver 14.14 Distrib 5.7.24, for linux-glibc2.12 (x86_64) using EditLine wrapper
Connection id: 16737
Current database:
Current user: root@localhost
SSL: Not in use
Current pager: stdout
Using outfile: ''
Using delimiter: ;
Server version: 5.7.24-log MySQL Community Server (GPL)
Protocol version: 10
Connection: Localhost via UNIX socket
Server characterset: utf8
Db characterset: utf8
Client characterset: utf8
Conn. characterset: utf8
UNIX socket: /data/mysql/mysql.sock
Uptime: 27 days 10 hours 9 min 0 sec
Threads: 37 Questions: 3437291 Slow queries: 10 Opens: 57716 Flush tables: 1027 Open tables: 1016 Queries per second avg: 1.450
--------------
-->占用空间最大的前10张大表
select table_schema,table_name,table_type,engine,create_time,update_time,table_collation,
sum(table_rows) as '记录数',
sum(truncate(data_length/1024/1024, 2)) as '数据容量(MB)',
sum(truncate(index_length/1024/1024, 2)) as '索引容量(MB)',
sum(truncate((data_length+index_length)/1024/1024, 2)) as '总大小(MB)',
sum(truncate(max_data_length/1024/1024, 2)) as '最大值(MB)'
from information_schema.tables
where TABLE_SCHEMA not in('information_schema','sys','mysql','performance_schema')
group by table_schema,table_name
order by sum((data_length+index_length)) desc limit 10;
-->占用空间最大的前10个索引
select ta.table_schema,ta.table_name,st.index_name,sum(truncate(index_length/1024/1024, 2)) as 'SizeMB',st.NON_UNIQUE,st.INDEX_TYPE,st.COLUMN_NAME
from information_schema.tables ta
left join information_schema.STATISTICS st
on ta.table_schema = st.table_schema and ta.table_name = st.table_name
where ta.TABLE_SCHEMA not in('information_schema','sys','mysql','performance_schema')
group by ta.table_schema,ta.table_name
order by sum(index_length) desc limit 10;
-->所有存储引擎列表
SELECT * FROM information_schema.ENGINES order by ENGINE
--》查询所有用户
select * from mysql.user order by user
--》一些重要的参数
show variables like '%autocommit%';
show variables like '%datadir%';
show variables like '%innodb_buffer_pool_size%';
show variables like '%innodb_file_per_table%';
show variables like '%innodb_flush_log_at_trx_commit%';
show variables like '%innodb_io_capacity';
show variables like '%innodb_lock_wait_timeout%';
show variables like '%log_error';
show variables like '%log_output%';
show variables like '%log_queries_not_using_indexes%';
show variables like '%log_slave_updates%';
show variables like '%log_throttle_queries_not_using_indexes%';
show variables like '%long_query_time%';
show variables like '%lower_case_table_names%';
show variables like '%max_connect_errors%';
show variables like '%max_connections%';
show variables like '%max_user_connections%';
show variables like '%pid_file%';
show variables like '%query_cache_size%';
show variables like '%query_cache_type%';
show variables like '%read_only%';
show variables like '%server_id%';
show variables like '%slow_query_log%';
show variables like '%slow_query_log_file%';
show variables like '%socket%';
show variables like '%sql_mode%';
show variables like '%time_zone%';
show variables like '%tx_isolation%';
--》查看每个host的当前连接数和总连接数
select * from performance_schema.accounts order by user
-->查询执行过全扫描访问的表,默认情况下按照表扫描的行数进行降序排序(前10)
SELECT object_schema as db,
object_name as table_name,
count_read AS rows_full_scanned,
sys.format_time(sum_timer_wait) AS execu_time
FROM performance_schema.table_io_waits_summary_by_index_usage
WHERE index_name IS NULL
AND count_read > 0
ORDER BY count_read DESC limit 10;
-->查看平均执行时间值大于95%的平均执行时间的语句(可近似地认为是平均执行时间超长的语句),默认情况下按照语句平均延迟(执行时间)降序排序(前10)
SELECT sys.format_statement(DIGEST_TEXT) AS query,
SCHEMA_NAME as db,
IF(SUM_NO_GOOD_INDEX_USED > 0 OR SUM_NO_INDEX_USED > 0, '*', '') AS full_scan,
COUNT_STAR AS exec_count,
SUM_ERRORS AS err_count,
SUM_WARNINGS AS warn_count,
sys.format_time(SUM_TIMER_WAIT) AS total_latency,
sys.format_time(MAX_TIMER_WAIT) AS max_latency,
sys.format_time(AVG_TIMER_WAIT) AS avg_latency,
SUM_ROWS_SENT AS rows_sent,
ROUND(IFNULL(SUM_ROWS_SENT / NULLIF(COUNT_STAR, 0), 0)) AS rows_sent_avg,
SUM_ROWS_EXAMINED AS rows_examined,
ROUND(IFNULL(SUM_ROWS_EXAMINED / NULLIF(COUNT_STAR, 0), 0)) AS rows_examined_avg,
FIRST_SEEN AS first_seen,
LAST_SEEN AS last_seen,
DIGEST AS digest
FROM performance_schema.events_statements_summary_by_digest stmts
JOIN sys.x$ps_digest_95th_percentile_by_avg_us AS top_percentile
ON ROUND(stmts.avg_timer_wait/1000000) >= top_percentile.avg_us
ORDER BY AVG_TIMER_WAIT DESC limit 10;
-->查看产生错误或警告的语句,默认情况下,按照错误数量和警告数量降序排序(前10)
SELECT sys.format_statement(DIGEST_TEXT) AS query,
SCHEMA_NAME as db,
COUNT_STAR AS exec_count,
SUM_ERRORS AS errors,
IFNULL(SUM_ERRORS / NULLIF(COUNT_STAR, 0), 0) * 100 as error_pct,
SUM_WARNINGS AS warnings,
IFNULL(SUM_WARNINGS / NULLIF(COUNT_STAR, 0), 0) * 100 as warning_pct,
FIRST_SEEN as first_seen,
LAST_SEEN as last_seen,
DIGEST AS digest
FROM performance_schema.events_statements_summary_by_digest
WHERE SUM_ERRORS > 0
OR SUM_WARNINGS > 0
ORDER BY SUM_ERRORS DESC, SUM_WARNINGS DESC limit 10;
-->查看全表扫描或者没有使用到最优索引的语句(前10)
SELECT sys.format_statement(DIGEST_TEXT) AS query,
SCHEMA_NAME as db,
COUNT_STAR AS exec_count,
sys.format_time(SUM_TIMER_WAIT) AS total_latency,
SUM_NO_INDEX_USED AS no_index_used_count,
SUM_NO_GOOD_INDEX_USED AS no_good_index_used_count,
ROUND(IFNULL(SUM_NO_INDEX_USED / NULLIF(COUNT_STAR, 0), 0) * 100) AS no_index_used_pct,
SUM_ROWS_SENT AS rows_sent,
SUM_ROWS_EXAMINED AS rows_examined,
ROUND(SUM_ROWS_SENT/COUNT_STAR) AS rows_sent_avg,
ROUND(SUM_ROWS_EXAMINED/COUNT_STAR) AS rows_examined_avg,
FIRST_SEEN as first_seen,
LAST_SEEN as last_seen,
DIGEST AS digest
FROM performance_schema.events_statements_summary_by_digest
WHERE (SUM_NO_INDEX_USED > 0
OR SUM_NO_GOOD_INDEX_USED > 0)
AND DIGEST_TEXT NOT LIKE 'SHOW%'
ORDER BY no_index_used_pct DESC, total_latency DESC limit 10;
-->查看执行了文件排序的语句,默认情况下按照语句总延迟时间(执行时间)降序排序(前10)
SELECT sys.format_statement(DIGEST_TEXT) AS query,
SCHEMA_NAME db,
COUNT_STAR AS exec_count,
sys.format_time(SUM_TIMER_WAIT) AS total_latency,
SUM_SORT_MERGE_PASSES AS sort_merge_passes,
ROUND(IFNULL(SUM_SORT_MERGE_PASSES / NULLIF(COUNT_STAR, 0), 0)) AS avg_sort_merges,
SUM_SORT_SCAN AS sorts_using_scans,
SUM_SORT_RANGE AS sort_using_range,
SUM_SORT_ROWS AS rows_sorted,
ROUND(IFNULL(SUM_SORT_ROWS / NULLIF(COUNT_STAR, 0), 0)) AS avg_rows_sorted,
FIRST_SEEN as first_seen,
LAST_SEEN as last_seen,
DIGEST AS digest
FROM performance_schema.events_statements_summary_by_digest
WHERE SUM_SORT_ROWS > 0
ORDER BY SUM_TIMER_WAIT DESC limit 10;
-->查看使用了临时表的语句,默认情况下按照磁盘临时表数量和内存临时表数量进行降序排序(前10)
SELECT sys.format_statement(DIGEST_TEXT) AS query,
SCHEMA_NAME as db,
COUNT_STAR AS exec_count,
sys.format_time(SUM_TIMER_WAIT) as total_latency,
SUM_CREATED_TMP_TABLES AS memory_tmp_tables,
SUM_CREATED_TMP_DISK_TABLES AS disk_tmp_tables,
ROUND(IFNULL(SUM_CREATED_TMP_TABLES / NULLIF(COUNT_STAR, 0), 0)) AS avg_tmp_tables_per_query,
ROUND(IFNULL(SUM_CREATED_TMP_DISK_TABLES / NULLIF(SUM_CREATED_TMP_TABLES, 0), 0) * 100) AS tmp_tables_to_disk_pct,
FIRST_SEEN as first_seen,
LAST_SEEN as last_seen,
DIGEST AS digest
FROM performance_schema.events_statements_summary_by_digest
WHERE SUM_CREATED_TMP_TABLES > 0
ORDER BY SUM_CREATED_TMP_DISK_TABLES DESC, SUM_CREATED_TMP_TABLES DESC limit 10;
--> 性能参数统计
show status like 'Com_delete';
show status like 'Com_insert';
show status like 'Com_select';
show status like 'Connections';
show status like 'Created_tmp_disk_tables';
show status like 'Created_tmp_files';
show status like 'Created_tmp_tables';
show status like 'Handler_read_rnd_next';
show status like 'Open_files';
show status like 'Opened_tables';
show status like 'Slow_queries';
show status like 'Sort_merge_passes';
show status like 'Sort_range';
show status like 'Sort_rows';
show status like 'Sort_scan';
show status like 'Table_locks_immediate';
show status like 'Table_locks_waited';
show status like 'Uptime';
```
## 涉及的shell
```shell
#!/bin/bash
ipaddress=`ip a|grep "global"| awk NR==1 |awk '{print $2}' |awk -F/ '{print $1}'`
today=`date +%Y%m%d`
#today=`date +%Y%m%d%H%M`
file_output=${ipaddress}'_'${today}'.html'
td_str=''
th_str=''
db_username="root"
db_passwd="123456"
db_ip="localhost"
db_port="3306"
mysql_cmd="mysql -u ${db_username} -p${db_passwd} -h${db_ip} -P${db_port} --protocol=tcp --silent"
# html+css
create_html_css(){
echo -e "
MySQL Report
MySQL数据库巡检报告
Copyright (c) 记忆角落. All rights reserved.
巡检时间: `date +%Y%m%d%H%M`
"
}
create_html_end(){
echo -e ""
}
create_h1_head(){
echo -e "$1
"
}
create_table_start(){
echo -e ""
}
create_table_end(){
echo -e "
"
}
create_td(){
td_str=`echo $1 | awk 'BEGIN{FS="|"}''{i=1; while(i<=NF) {print ""$i" | ";i++}}'`
}
create_th(){
th_str=`echo $1|awk 'BEGIN{FS="|"}''{i=1; while(i<=NF) {print ""$i" | ";i++}}'`
}
create_tr1(){
create_td "$1"
echo -e "
$td_str
" >> $file_output
}
create_tr2(){
create_th "$1"
echo -e "
$th_str
" >> $file_output
}
create_tr3(){
echo -e "
`cat $1`
|
" >> $file_output
}
cmd_db_base_info_sql(){
${mysql_cmd} -e "select now(),user(),current_user(),CONNECTION_ID(),DATABASE(),version(),all_db_size,@@basedir base_dit,@@datadir as data_dir,@@SOCKET as socket_dir,@@log_error as error_dir,@@AUTOCOMMIT as autocommit,@@log_bin as log_bin,@@server_id as server_id from (SELECT concat(round(sum(DATA_LENGTH/1024/1024),2),'MB') as 'all_db_size' from information_schema.TABLES) tmp"
}
db_base_info(){
create_h1_head "数据库基本信息" >> ${file_output}
create_table_start >> ${file_output}
echo "now() |user() | current_user() |CONNECTION_ID() | DATABASE() | version() | all_db_size | base_dit | data_dir | socket_dir | error_dir | autocommit | log_bin | server_id" > /tmp/tmp_inspecting_mysql_table.txt
cmd_db_base_info_sql >> /tmp/tmp_db_base_info_`date +%Y%m%d%H%M`.txt
sed -i 's/\t/|/g' /tmp/tmp_db_base_info_`date +%Y%m%d%H%M`.txt
while read line
do
create_tr2 "$line"
done < /tmp/tmp_inspecting_mysql_table.txt
while read line
do
create_tr1 "$line"
done < /tmp/tmp_db_base_info_`date +%Y%m%d%H%M`.txt
create_table_end >> ${file_output}
}
cmd_db_version_info_sql(){
${mysql_cmd} -e "show variables like '%version_comment%';"
${mysql_cmd} -e "show variables like '%version_compile_machine%';"
${mysql_cmd} -e "show variables like '%version_compile_os%';"
}
db_version_info(){
create_h1_head "版本信息" >> ${file_output}
create_table_start >> ${file_output}
echo "Variable_name | Value" > /tmp/tmp_inspecting_mysql_table.txt
while read line
do
create_tr2 "$line"
done < /tmp/tmp_inspecting_mysql_table.txt
cmd_db_version_info_sql >> /tmp/tmp_db_version_info_`date +%Y%m%d%H%M`.txt
sed -i 's/\t/|/g' /tmp/tmp_db_version_info_`date +%Y%m%d%H%M`.txt
while read line
do
create_tr1 "$line"
done < /tmp/tmp_db_version_info_`date +%Y%m%d%H%M`.txt
create_table_end >> ${file_output}
}
cmd_db_usage_sql(){
${mysql_cmd} -e "SELECT SCHEMA_NAME, DEFAULT_CHARACTER_SET_NAME, DEFAULT_COLLATION_NAME, sum(table_rows) AS \"记录数\" , sum(truncate(data_length / 1024 / 1024, 2)) AS \"数据容量(MB)\" , sum(truncate(index_length / 1024 / 1024, 2)) AS \"索引容量(MB)\" , sum(truncate((data_length + index_length) / 1024 / 1024, 2)) AS \"总大小(MB)\" , sum(truncate(max_data_length / 1024 / 1024, 2)) AS \"最大值(MB)\" FROM information_schema.SCHEMATA ma LEFT JOIN information_schema.tables ta ON ma.SCHEMA_NAME = ta.table_schema GROUP BY SCHEMA_NAME ORDER BY sum(data_length) DESC, sum(index_length) DESC;"
}
db_usage(){
create_h1_head "当前数据库实例的所有数据库及其容量大小" >> ${file_output}
create_table_start >> ${file_output}
echo "SCHEMA_NAME|DEFAULT_CHARACTER_SET_NAME|DEFAULT_COLLATION_NAME|记录数|数据容量(MB)|索引容量(MB)|总大小(MB)|最大值(MB)" > /tmp/tmp_inspecting_mysql_table.txt
while read line
do
create_tr2 "$line"
done < /tmp/tmp_inspecting_mysql_table.txt
cmd_db_usage_sql >> /tmp/tmp_db_usage_`date +%Y%m%d%H%M`.txt
sed -i 's/\t/|/g' /tmp/tmp_db_usage_`date +%Y%m%d%H%M`.txt
while read line
do
create_tr1 "$line"
done < /tmp/tmp_db_usage_`date +%Y%m%d%H%M`.txt
create_table_end >> ${file_output}
}
cmd_db_object_sql(){
${mysql_cmd} -e "SELECT * FROM ( SELECT table_schema AS \"数据库\", 'TABLE' AS \"对象类型\", COUNT(*) AS \"对象数量\" FROM information_schema.TABLES GROUP BY table_schema UNION SELECT table_schema AS \"数据库\", 'VIEW' AS \"对象类型\", COUNT(*) AS \"对象数量\" FROM information_schema.VIEWS GROUP BY table_schema UNION SELECT db AS \"数据库\", 'PROCEDURE' AS \"对象类型\", COUNT(*) AS \"对象数量\" FROM mysql.proc WHERE type = 'PROCEDURE' GROUP BY db UNION SELECT db AS \"数据库\", 'FUNCTION' AS \"对象类型\", COUNT(*) AS \"对象数量\" FROM mysql.proc WHERE type = 'FUNCTION' GROUP BY db ) tmp ORDER BY \"数据库\", \"对象类型\""
}
db_object(){
create_h1_head "数据库对象" >> ${file_output}
create_table_start >> ${file_output}
echo "数据库|对象类型|对象数量" > /tmp/tmp_inspecting_mysql_table.txt
while read line
do
create_tr2 "$line"
done < /tmp/tmp_inspecting_mysql_table.txt
cmd_db_object_sql >> /tmp/tmp_db_object_`date +%Y%m%d%H%M`.txt
sed -i 's/\t/|/g' /tmp/tmp_db_object_`date +%Y%m%d%H%M`.txt
while read line
do
create_tr1 "$line"
done < /tmp/tmp_db_object_`date +%Y%m%d%H%M`.txt
create_table_end >> ${file_output}
}
db_status(){
create_h1_head "查看数据库的运行状态" >> ${file_output}
create_table_start >> ${file_output}
${mysql_cmd} -e "status" > /tmp/tmp_db_status_`date +%Y%m%d%H%M`.txt
create_tr3 /tmp/tmp_db_status_`date +%Y%m%d%H%M`.txt
create_table_end >> ${file_output}
}
cmd_db_top_ten_big_tables_sql(){
${mysql_cmd} -e "SELECT table_schema, table_name, table_type, engine, create_time , update_time, table_collation, sum(table_rows) AS \"记录数\" , sum(truncate(data_length / 1024 / 1024, 2)) AS \"数据容量(MB)\" , sum(truncate(index_length / 1024 / 1024, 2)) AS \"索引容量(MB)\" , sum(truncate((data_length + index_length) / 1024 / 1024, 2)) AS \"总大小(MB)\" , sum(truncate(max_data_length / 1024 / 1024, 2)) AS \"最大值(MB)\" FROM information_schema.tables WHERE TABLE_SCHEMA NOT IN ('information_schema', 'sys', 'mysql', 'performance_schema') GROUP BY table_schema, table_name ORDER BY sum(data_length + index_length) DESC LIMIT 10;"
}
db_top_ten_big_tables(){
create_h1_head "数据库对象占用空间最大的前10张大表" >> ${file_output}
create_table_start >> ${file_output}
echo "table_schema|table_name|table_type|engine|create_time|update_time|table_collation|记录数|数据容量(MB)|索引容量(MB)|总大小(MB)|最大值(MB)" > /tmp/tmp_inspecting_mysql_table.txt
while read line
do
create_tr2 "$line"
done < /tmp/tmp_inspecting_mysql_table.txt
cmd_db_top_ten_big_tables_sql >> /tmp/tmp_db_top_ten_big_tables_`date +%Y%m%d%H%M`.txt
sed -i 's/\t/|/g' /tmp/tmp_db_top_ten_big_tables_`date +%Y%m%d%H%M`.txt
while read line
do
create_tr1 "$line"
done < /tmp/tmp_db_top_ten_big_tables_`date +%Y%m%d%H%M`.txt
create_table_end >> ${file_output}
}
cmd_db_top_ten_index_sql(){
${mysql_cmd} -e "SELECT ta.table_schema, ta.table_name, st.index_name , sum(truncate(index_length / 1024 / 1024, 2)) AS \"SizeMB\" , st.NON_UNIQUE, st.INDEX_TYPE, st.COLUMN_NAME FROM information_schema.tables ta LEFT JOIN information_schema.STATISTICS st ON ta.table_schema = st.table_schema AND ta.table_name = st.table_name WHERE ta.TABLE_SCHEMA NOT IN ('information_schema', 'sys', 'mysql', 'performance_schema') GROUP BY ta.table_schema, ta.table_name ORDER BY sum(index_length) DESC LIMIT 10;"
}
db_top_ten_index(){
create_h1_head "占用空间最大的前10个索引" >> ${file_output}
create_table_start >> ${file_output}
echo "table_schema|table_name|index_name|SizeMB|NON_UNIQUE|INDEX_TYPE|COLUMN_NAME" > /tmp/tmp_inspecting_mysql_table.txt
while read line
do
create_tr2 "$line"
done < /tmp/tmp_inspecting_mysql_table.txt
cmd_db_top_ten_index_sql >> /tmp/tmp_db_top_ten_index_`date +%Y%m%d%H%M`.txt
sed -i 's/\t/|/g' /tmp/tmp_db_top_ten_index_`date +%Y%m%d%H%M`.txt
while read line
do
create_tr1 "$line"
done < /tmp/tmp_db_top_ten_index_`date +%Y%m%d%H%M`.txt
create_table_end >> ${file_output}
}
cmd_db_all_user_sql(){
${mysql_cmd} -e "select * from mysql.user order by user;"
}
db_all_user(){
create_h1_head "查询所有用户" >> ${file_output}
create_table_start >> ${file_output}
echo "Host|User|Select_priv|Insert_priv|Update_priv|Delete_priv|Create_priv|Drop_priv|Reload_priv|Shutdown_priv|Process_priv|File_priv|Grant_priv|References_priv|Index_priv|Alter_priv|Show_db_priv|Super_priv|Create_tmp_table_priv|Lock_tables_priv|Execute_priv|Repl_slave_priv|Repl_client_priv|Create_view_priv|Show_view_priv|Create_routine_priv|Alter_routine_priv|Create_user_priv|Event_priv|Trigger_priv|Create_tablespace_priv|ssl_type|ssl_cipher|x509_issuer|x509_subject|max_questions|max_updates|max_connections|max_user_connections|plugin|authentication_string|password_expired|password_last_changed|password_lifetime|account_locked" > /tmp/tmp_inspecting_mysql_table.txt
while read line
do
create_tr2 "$line"
done < /tmp/tmp_inspecting_mysql_table.txt
cmd_db_all_user_sql >> /tmp/tmp_db_all_user_`date +%Y%m%d%H%M`.txt
sed -i 's/\t/|/g' /tmp/tmp_db_all_user_`date +%Y%m%d%H%M`.txt
while read line
do
create_tr1 "$line"
done < /tmp/tmp_db_all_user_`date +%Y%m%d%H%M`.txt
create_table_end >> ${file_output}
}
cmd_db_some_important_para_sql(){
${mysql_cmd} -e "show variables like '%autocommit%';"
${mysql_cmd} -e "show variables like '%datadir%';"
${mysql_cmd} -e "show variables like '%innodb_buffer_pool_size%';"
${mysql_cmd} -e "show variables like '%innodb_file_per_table%';"
${mysql_cmd} -e "show variables like '%innodb_flush_log_at_trx_commit%';"
${mysql_cmd} -e "show variables like '%innodb_io_capacity';"
${mysql_cmd} -e "show variables like '%innodb_lock_wait_timeout%';"
${mysql_cmd} -e "show variables like '%log_error';"
${mysql_cmd} -e "show variables like '%log_output%';"
${mysql_cmd} -e "show variables like '%log_queries_not_using_indexes%';"
${mysql_cmd} -e "show variables like '%log_slave_updates%';"
${mysql_cmd} -e "show variables like '%log_throttle_queries_not_using_indexes%';"
${mysql_cmd} -e "show variables like '%long_query_time%';"
${mysql_cmd} -e "show variables like '%lower_case_table_names%';"
${mysql_cmd} -e "show variables like '%max_connect_errors%';"
${mysql_cmd} -e "show variables like '%max_connections%';"
${mysql_cmd} -e "show variables like '%max_user_connections%';"
${mysql_cmd} -e "show variables like '%pid_file%';"
${mysql_cmd} -e "show variables like '%query_cache_size%';"
${mysql_cmd} -e "show variables like '%query_cache_type%';"
${mysql_cmd} -e "show variables like '%read_only%';"
${mysql_cmd} -e "show variables like '%server_id%';"
${mysql_cmd} -e "show variables like '%slow_query_log%';"
${mysql_cmd} -e "show variables like '%slow_query_log_file%';"
${mysql_cmd} -e "show variables like '%socket%';"
${mysql_cmd} -e "show variables like '%sql_mode%';"
${mysql_cmd} -e "show variables like '%time_zone%';"
${mysql_cmd} -e "show variables like '%tx_isolation%';"
}
db_some_important_para(){
create_h1_head "重要的参数" >> ${file_output}
create_table_start >> ${file_output}
echo "Variable_name | Value" > /tmp/tmp_inspecting_mysql_table.txt
while read line
do
create_tr2 "$line"
done < /tmp/tmp_inspecting_mysql_table.txt
cmd_db_some_important_para_sql >> /tmp/tmp_db_some_important_para_`date +%Y%m%d%H%M`.txt
sed -i 's/\t/|/g' /tmp/tmp_db_some_important_para_`date +%Y%m%d%H%M`.txt
while read line
do
create_tr1 "$line"
done < /tmp/tmp_db_some_important_para_`date +%Y%m%d%H%M`.txt
create_table_end >> ${file_output}
}
cmd_db_current_and_total_connections_num(){
${mysql_cmd} -e "select * from performance_schema.accounts order by user;"
}
db_current_and_total_connections_num(){
create_h1_head "查看每个host的当前连接数和总连接数" >> ${file_output}
create_table_start >> ${file_output}
echo "USER|HOST|CURRENT_CONNECTIONS|TOTAL_CONNECTIONS" > /tmp/tmp_inspecting_mysql_table.txt
while read line
do
create_tr2 "$line"
done < /tmp/tmp_inspecting_mysql_table.txt
cmd_db_current_and_total_connections_num >> /tmp/tmp_db_current_and_total_connections_num_`date +%Y%m%d%H%M`.txt
sed -i 's/\t/|/g' /tmp/tmp_db_current_and_total_connections_num_`date +%Y%m%d%H%M`.txt
while read line
do
create_tr1 "$line"
done < /tmp/tmp_db_current_and_total_connections_num_`date +%Y%m%d%H%M`.txt
create_table_end >> ${file_output}
}
cmd_db_query_tables_have_full_scan_sql(){
${mysql_cmd} -e "SELECT object_schema AS db, object_name AS table_name, count_read AS rows_full_scanned, sys.format_time(sum_timer_wait) AS execu_time FROM performance_schema.table_io_waits_summary_by_index_usage WHERE index_name IS NULL AND count_read > 0 ORDER BY count_read DESC LIMIT 10;"
}
db_query_tables_have_full_scan(){
create_h1_head "查询执行过全扫描访问的表,默认情况下按照表扫描的行数进行降序排序(前10)" >> ${file_output}
create_table_start >> ${file_output}
echo "db|table_name|rows_full_scanned|execu_time" > /tmp/tmp_inspecting_mysql_table.txt
while read line
do
create_tr2 "$line"
done < /tmp/tmp_inspecting_mysql_table.txt
cmd_db_query_tables_have_full_scan_sql >> /tmp/tmp_db_query_tables_have_full_scan_`date +%Y%m%d%H%M`.txt
sed -i 's/\t/|/g' /tmp/tmp_db_query_tables_have_full_scan_`date +%Y%m%d%H%M`.txt
while read line
do
create_tr1 "$line"
done < /tmp/tmp_db_query_tables_have_full_scan_`date +%Y%m%d%H%M`.txt
create_table_end >> ${file_output}
}
cmd_db_execution_time_values_greater_than_95_sql(){
${mysql_cmd} -e "SELECT sys.format_statement(DIGEST_TEXT) AS query, SCHEMA_NAME AS db , IF(SUM_NO_GOOD_INDEX_USED > 0 OR SUM_NO_INDEX_USED > 0, '*', '') AS full_scan , COUNT_STAR AS exec_count, SUM_ERRORS AS err_count, SUM_WARNINGS AS warn_count, sys.format_time(SUM_TIMER_WAIT) AS total_latency , sys.format_time(MAX_TIMER_WAIT) AS max_latency, sys.format_time(AVG_TIMER_WAIT) AS avg_latency , SUM_ROWS_SENT AS rows_sent , ROUND(IFNULL(SUM_ROWS_SENT / NULLIF(COUNT_STAR, 0), 0)) AS rows_sent_avg , SUM_ROWS_EXAMINED AS rows_examined , ROUND(IFNULL(SUM_ROWS_EXAMINED / NULLIF(COUNT_STAR, 0), 0)) AS rows_examined_avg , FIRST_SEEN AS first_seen, LAST_SEEN AS last_seen, DIGEST AS digest FROM performance_schema.events_statements_summary_by_digest stmts JOIN sys.x\$ps_digest_95th_percentile_by_avg_us top_percentile ON ROUND(stmts.avg_timer_wait / 1000000) >= top_percentile.avg_us ORDER BY AVG_TIMER_WAIT DESC LIMIT 10;"
}
db_execution_time_values_greater_than_95(){
create_h1_head "查询执行过全扫描访问的表,默认情况下按照表扫描的行数进行降序排序(前10)" >> ${file_output}
create_table_start >> ${file_output}
echo "query|db|full_scan|exec_count|err_count|warn_count|total_latency|max_latency|avg_latency|rows_sent|rows_sent_avg|rows_examined|rows_examined_avg|first_seen|last_seen|digest" > /tmp/tmp_inspecting_mysql_table.txt
while read line
do
create_tr2 "$line"
done < /tmp/tmp_inspecting_mysql_table.txt
cmd_db_execution_time_values_greater_than_95_sql >> /tmp/tmp_db_execution_time_values_greater_than_95_`date +%Y%m%d%H%M`.txt
sed -i 's/\t/|/g' /tmp/tmp_db_execution_time_values_greater_than_95_`date +%Y%m%d%H%M`.txt
while read line
do
create_tr1 "$line"
done < /tmp/tmp_db_execution_time_values_greater_than_95_`date +%Y%m%d%H%M`.txt
create_table_end >> ${file_output}
}
cmd_db_statements_that_generate_errors_or_warnings_sql(){
${mysql_cmd} -e "SELECT sys.format_statement(DIGEST_TEXT) AS query, SCHEMA_NAME AS db, COUNT_STAR AS exec_count, SUM_ERRORS AS errors , IFNULL(SUM_ERRORS / NULLIF(COUNT_STAR, 0), 0) * 100 AS error_pct , SUM_WARNINGS AS warnings , IFNULL(SUM_WARNINGS / NULLIF(COUNT_STAR, 0), 0) * 100 AS warning_pct , FIRST_SEEN AS first_seen, LAST_SEEN AS last_seen, DIGEST AS digest FROM performance_schema.events_statements_summary_by_digest WHERE SUM_ERRORS > 0 OR SUM_WARNINGS > 0 ORDER BY SUM_ERRORS DESC, SUM_WARNINGS DESC LIMIT 10;"
}
db_statements_that_generate_errors_or_warnings(){
create_h1_head "查看产生错误或警告的语句,默认情况下,按照错误数量和警告数量降序排序(前10)" >> ${file_output}
create_table_start >> ${file_output}
echo "query|db|exec_count|errors|error_pct|warnings|warning_pct|first_seen|last_seen|digest" > /tmp/tmp_inspecting_mysql_table.txt
while read line
do
create_tr2 "$line"
done < /tmp/tmp_inspecting_mysql_table.txt
cmd_db_statements_that_generate_errors_or_warnings_sql >> /tmp/tmp_db_statements_that_generate_errors_or_warnings_`date +%Y%m%d%H%M`.txt
sed -i 's/\t/|/g' /tmp/tmp_db_statements_that_generate_errors_or_warnings_`date +%Y%m%d%H%M`.txt
while read line
do
create_tr1 "$line"
done < /tmp/tmp_db_statements_that_generate_errors_or_warnings_`date +%Y%m%d%H%M`.txt
create_table_end >> ${file_output}
}
cmd_db_performance_parameter_statistics_sql(){
${mysql_cmd} -e "show status like 'Com_delete';"
${mysql_cmd} -e "show status like 'Com_insert';"
${mysql_cmd} -e "show status like 'Com_select';"
${mysql_cmd} -e "show status like 'Connections';"
${mysql_cmd} -e "show status like 'Created_tmp_disk_tables';"
${mysql_cmd} -e "show status like 'Created_tmp_files';"
${mysql_cmd} -e "show status like 'Created_tmp_tables';"
${mysql_cmd} -e "show status like 'Handler_read_rnd_next';"
${mysql_cmd} -e "show status like 'Open_files';"
${mysql_cmd} -e "show status like 'Opened_tables';"
${mysql_cmd} -e "show status like 'Slow_queries';"
${mysql_cmd} -e "show status like 'Sort_merge_passes';"
${mysql_cmd} -e "show status like 'Sort_range';"
${mysql_cmd} -e "show status like 'Sort_rows';"
${mysql_cmd} -e "show status like 'Sort_scan';"
${mysql_cmd} -e "show status like 'Table_locks_immediate';"
${mysql_cmd} -e "show status like 'Table_locks_waited';"
${mysql_cmd} -e "show status like 'Uptime';"
}
db_performance_parameter_statistics(){
create_h1_head "性能参数统计" >> ${file_output}
create_table_start >> ${file_output}
echo "Variable_name | Value" > /tmp/tmp_inspecting_mysql_table.txt
while read line
do
create_tr2 "$line"
done < /tmp/tmp_inspecting_mysql_table.txt
cmd_db_performance_parameter_statistics_sql >> /tmp/tmp_db_version_info_`date +%Y%m%d%H%M`.txt
sed -i 's/\t/|/g' /tmp/tmp_db_version_info_`date +%Y%m%d%H%M`.txt
while read line
do
create_tr1 "$line"
done < /tmp/tmp_db_version_info_`date +%Y%m%d%H%M`.txt
create_table_end >> ${file_output}
}
create_html_file(){
rm -rf ${file_output}
touch ${file_output}
create_html_css >> ${file_output}
# 数据库基本信息 start
db_base_info
# 版本信息 start
db_version_info
# 重要的参数
db_some_important_para
# 性能参数统计
db_performance_parameter_statistics
# 查看数据库的运行状态
db_status
# 当前数据库实例的所有数据库及其容量大小
db_usage
# 查询所有用户
db_all_user
# 查看每个host的当前连接数和总连接数
db_current_and_total_connections_num
# 数据库对象
db_object
# 占用空间最大的前10张大表
db_top_ten_big_tables
# 占用空间最大的前10个索引
db_top_ten_index
# 查询执行过全扫描访问的表,默认情况下按照表扫描的行数进行降序排序(前10)
db_query_tables_have_full_scan
# 查看平均执行时间值大于95%的平均执行时间的语句(可近似地认为是平均执行时间超长的语句),默认情况下按照语句平均延迟(执行时间)降序排序(前10)
db_execution_time_values_greater_than_95
# 查看产生错误或警告的语句,默认情况下,按照错误数量和警告数量降序排序(前10)
db_statements_that_generate_errors_or_warnings
# 查看全表扫描或者没有使用到最优索引的语句(前10)
# 查看执行了文件排序的语句,默认情况下按照语句总延迟时间(执行时间)降序排序(前10)
# 查看使用了临时表的语句,默认情况下按照磁盘临时表数量和内存临时表数量进行降序排序(前10)
create_html_end >> ${file_output}
rm -f /tmp/tmp_db_*.txt
}
RUID=`id|awk -F\( '{print $1}'|awk -F\= '{print $2}'`
if [ ${RUID} != "0" ];then
echo"This script must be executed as root"
exit 1
fi
create_html_file
```