# performance-bookmarklet
**Repository Path**: YyuLin/performance-bookmarklet
## Basic Information
- **Project Name**: performance-bookmarklet
- **Description**: No description available
- **Primary Language**: Unknown
- **License**: MIT
- **Default Branch**: master
- **Homepage**: None
- **GVP Project**: No
## Statistics
- **Stars**: 0
- **Forks**: 0
- **Created**: 2020-12-30
- **Last Updated**: 2020-12-30
## Categories & Tags
**Categories**: Uncategorized
**Tags**: None
## README
Performance-Bookmarklet
=======================
Bookmarklet, [Chrome Extension](https://chrome.google.com/webstore/detail/performance-analyser/djgfmlohefpomchfabngccpbaflcahjf) and [Firefox add-on](https://addons.mozilla.org/en-US/firefox/addon/performance-analyser/) to analyze the current page through the [Resource Timing API](http://www.w3.org/TR/resource-timing), [Navigation Timing API](http://www.w3.org/TR/navigation-timing) and [User-Timing](http://www.w3.org/TR/user-timing/) - requests by type, domain, load times, marks and more - sort of a light live WebPageTest.
Just add this into the URL section of a new bookmark:
```
javascript:(function(){var el=document.createElement('script');el.type='text/javascript';el.src='https://micmro.github.io/performance-bookmarklet/dist/performanceBookmarklet.min.js';el.onerror=function(){alert("Looks like the Content Security Policy directive is blocking the use of bookmarklets\n\nYou can copy and paste the content of:\n\n\"https://micmro.github.io/performance-bookmarklet/dist/performanceBookmarklet.min.js\"\n\ninto your console instead\n\n(link is in console already)");console.log("https://micmro.github.io/performance-bookmarklet/dist/performanceBookmarklet.min.js");};document.getElementsByTagName('body')[0].appendChild(el);})();
```
You can use the Performance-Bookmarklet (renamed as Performance-Analyser since it's not a Bookmarklet) as [Chrome Extension](https://chrome.google.com/webstore/detail/performance-analyser/djgfmlohefpomchfabngccpbaflcahjf) or [Firefox add-on](https://addons.mozilla.org/en-US/firefox/addon/performance-analyser/).
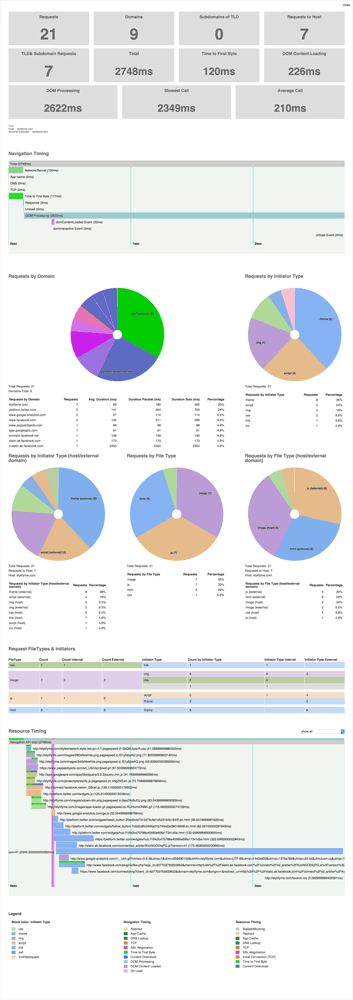
Bookmarklet Output in Detail
----------------------------
### Navigation Timing Waterfall

- It also displays markers and measures if you're setting marks with the [User Timing API](http://www.w3.org/TR/user-timing) (`performance.mark` and `performance.measure`)
- Hover over the bars to see a tooltip with the exact Milliseconds/duration
Navigation Timing API Details
### Domain/Resource analysis

- Requests by domain:
- How many requests are added by 3rd parties - green wedges represent the current TLD and subdomains
- Avg. Duration: the mean of all request of this domain
- Duration Parallel: actual time a domain spends on the wire - de-duping parallel request duration
- Duration Sum: simple sum of the duration of all requests of this domain
- Percentage: the percentage of all requests coming from this domain
- Requests by Initiator Type
- Requests by Type - what content type is accountable for the majority of requests
- Internal / extenal comparison charts
*external is currently everything except the current host - exluding sub domains*
### Resource Timing Waterfall with Markers

- The small bars inside the resource bar represent the different stages of the request (redirect, domainLookup, connect, secureConnect, requestToResponseStart, response), but are mostly unavailable for cross-domain requests.
- The resource bar colours indicates the initiatorType
- You can filter the waterfall chart by domain
Resource Timing API Details
Console Output
--------------
The bookmarklet also outputs various console tables ([where supported](https://developer.mozilla.org/en-US/docs/Web/API/Console/table)) to analyze the data in detail.

Various page metrics can be persisted between page refreshes and later displayed in the console, when ticking the `Persist Data?` checkbox.
How to use this snippet
-----------------------
You can use it as bookmarklet. Mozilla has a [step by step description](https://support.mozilla.org/en-US/kb/bookmarklets-perform-common-web-page-tasks#w_how-do-i-install-a-bookmarklet) on how to add a bookmarklet.
```
javascript:(function(){var el=document.createElement('script');el.type='text/javascript';el.src='https://micmro.github.io/performance-bookmarklet/dist/performanceBookmarklet.min.js';el.onerror=function(){alert("Looks like the Content Security Policy directive is blocking the use of bookmarklets\n\nYou can copy and paste the content of:\n\n\"https://micmro.github.io/performance-bookmarklet/dist/performanceBookmarklet.min.js\"\n\ninto your console instead\n\n(link is in console already)");console.log("https://micmro.github.io/performance-bookmarklet/dist/performanceBookmarklet.min.js");};document.getElementsByTagName('body')[0].appendChild(el);})();
```
Or alternatifly just copy and paste the content of [performanceBookmarklet.js](https://raw.githubusercontent.com/micmro/performance-bookmarklet/master/dist/performanceBookmarklet.js) to your browser console.
**You need to fall back to the browser extension or the copy and paste version for sites that block external scripts in their Content Security Policy directives.**
Browser Extensions
------------------
performance-bookmarklet can also be used as [Chrome Extension](https://chrome.google.com/webstore/detail/performance-analyser/djgfmlohefpomchfabngccpbaflcahjf) and [Firefox add-on](https://addons.mozilla.org/en-US/firefox/addon/performance-analyser/). It uses the same code, but has some usability advantages, e.g. you don't need to worry about the Content Security Policy directives.
Read more
-----------
- [Introduction to Resource Timing API](http://googledevelopers.blogspot.ca/2013/12/measuring-network-performance-with.html)
- [Resource Timing API Browser Support](http://caniuse.com/#feat=resource-timing)
- [HTML5 Rocks: Measuring Page Load Speed with Navigation Timing](http://www.html5rocks.com/en/tutorials/webperformance/basics)